4727.0.55.003 - Australian Aboriginal and Torres Strait Islander Health Survey: Biomedical Results, 2012-13
ARCHIVED ISSUE Released at 11:30 AM (CANBERRA TIME) 10/09/2014 First Issue
Page tools:
 Print Page Print Page
 Print All Print All
| ||||||||||||||||||||||||||||||||||||||||||
|
Introduction Despite a small narrowing in the life expectancy gap in recent years, the life expectancy for Aboriginal and Torres Strait Islander people is still around 10 years lower than for other Australians.1 A major contributor to this mortality gap is chronic disease, which is estimated to account for around two-thirds of all premature deaths among Aboriginal and Torres Strait Islander Australians.2 The 2012–13 Australian Aboriginal and Torres Strait Islander Health Survey (AATSIHS) results have highlighted the extent of poor health among Aboriginal and Torres Strait Islander people compared with other Australians. The biomedical test results from the groundbreaking National Aboriginal and Torres Strait Islander Health Measures Survey (NATSIHMS) also showed large disparities in chronic disease prevalence between the two populations. This article looks more closely at how diabetes, cardiovascular disease and chronic kidney disease (as measured in the NATSIHMS) differ between Aboriginal and Torres Strait Islander people and non-Indigenous Australians. How much more at risk of chronic disease are Aboriginal and Torres Strait Islander people compared to other Australians? The NATSIHMS showed that Aboriginal and Torres Strait Islander adults were more likely than non-Indigenous adults to have abnormal results for nearly every chronic disease that was tested for. After taking age differences between the two populations into account, Aboriginal and Torres Strait Islander people (compared with non-Indigenous people) were:
Persons aged 18 years and over: Age standardised rate ratios for chronic disease biomarkers, 2011–13
(b) The rate ratio is calculated by dividing the age standardised prevalence rate for Aboriginal and Torres Strait Islander people in non-remote areas by the age standardised prevalence rate for all non-Indigenous people. (c) The rate ratio is calculated by dividing the age standardised prevalence rate for all Aboriginal and Torres Strait Islander people by the age standardised prevalence rate for all non-Indigenous people. The only exception to this pattern was total cholesterol, where fewer Aboriginal and Torres Strait Islander people had high cholesterol compared with non-Indigenous people. However, this likely due to more Aboriginal and Torres Strait Islander people taking cholesterol-lowering medication (rate ratio 1.6). Are Aboriginal and Torres Strait Islander people who have certain conditions, like diabetes, also more likely to have other conditions too? Diabetes, cardiovascular disease and chronic kidney disease are all risk factors for each other and often occur together in the same individual.3 Co-morbidity between these conditions was more common for Aboriginal and Torres Strait Islander people than for non-Indigenous people in 2011–13. Diabetes in particular had very high co-morbidity with kidney disease, with around half (53.1%) of all Aboriginal and Torres Strait Islander people with diabetes also having signs of kidney disease. This was higher than the corresponding rate for non-Indigenous people with diabetes (32.5%). Aboriginal and Torres Strait Islander people with diabetes were also more likely than non-Indigenous people with diabetes to have indicators of cardiovascular disease, including high triglycerides (45.1% compared with 31.8%) and lower than normal levels of HDL (good) cholesterol (60.5% compared with 48.8%). 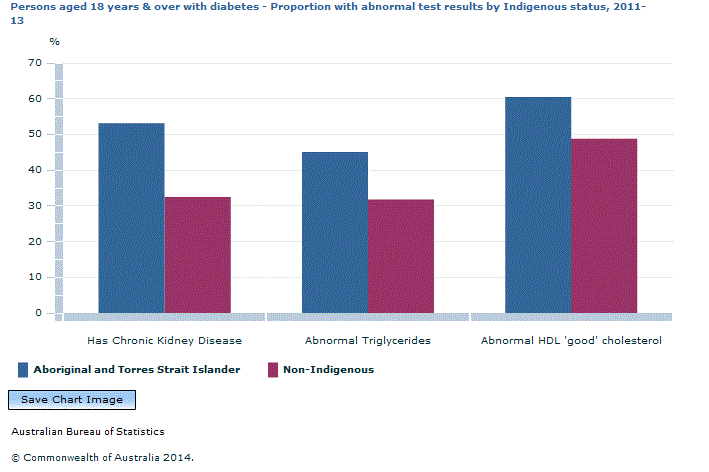 Source(s): Australian Aboriginal and Torres Strait Islander Health Survey: Biomedical Results There was also a high level of co-morbidity between kidney disease and the cardiovascular risk factors, with more than half (54.1%) of Aboriginal and Torres Strait Islander people with chronic kidney disease having lower than normal levels of HDL cholesterol and 37.5% having high triglycerides. This, too, was higher than the corresponding rates for the non-Indigenous population (25.8% and 19.6% respectively). The NATSIHMS confirmed that not only do Aboriginal and Torres Strait Islander people experience more chronic disease overall, they tend to develop it at younger ages as well. For diabetes, the gap between the two populations began to significantly widen from 35 years onwards. In fact, the rate of diabetes for Aboriginal and Torres Strait Islander people aged 35–44 years (9.0%) was on par with that for non-Indigenous people aged 55–64 years (8.2%). Likewise, the proportion for those aged 45–54 years (17.8%) was similar to that for those aged 65–74 years in the non-Indigenous population (15.0%). 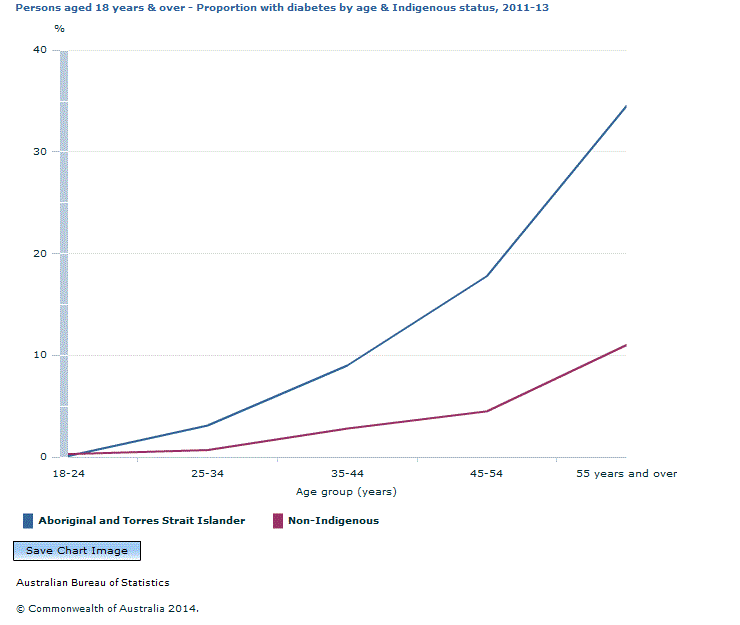 Source(s): Australian Aboriginal and Torres Strait Islander Health Survey: Biomedical Results For kidney disease, rates began to increase from early adulthood in the Aboriginal and Torres Strait Islander population and then more noticeably from 45 years onwards, whereas in the non-Indigenous population, levels of kidney disease remained very flat until late adulthood and only began to increase from the age of 65.  Source(s): Australian Aboriginal and Torres Strait Islander Health Survey: Biomedical Results For the cardiovascular biomarkers of HDL (good) cholesterol and triglycerides, the gap between the Aboriginal and Torres Strait Islander population and non-Indigenous population significantly increases from 35 years. For example, Aboriginal and Torres Strait Islander people aged 35–44 years were around twice as likely as their non-Indigenous counterparts to have high triglycerides (32.2% compared with 14.9%) and lower than normal levels of HDL cholesterol (46.8% compared with 24.5%). Obesity is known to increase the risk of many health conditions, including heart disease, diabetes, high blood pressure and some types of cancer.4,5 The AATSIHS showed that obesity rates remained high among Aboriginal and Torres Strait Islander adults in 2012–13, with four in every ten (39.8%) being obese.6 After taking age differences into account, Aboriginal and Torres Strait Islander adults were one and a half times as likely as non-Indigenous Australians to be obese (rate ratio 1.6). Obesity, in turn, was strongly associated with the chronic disease biomarkers. In fact, being obese increased the risk of abnormal test results for nearly every chronic disease tested for in the survey. For example, Aboriginal and Torres Strait Islander adults who were obese were seven times as likely as those who were of normal weight or underweight to have diabetes and nearly five times as likely to have high triglycerides. Interestingly, though, Aboriginal and Torres Strait Islander people who were obese were still more likely than non-Indigenous people who were obese to experience chronic disease. They were more likely to have risk factors for cardiovascular disease, including lower than normal levels of HDL (good) cholesterol (49.1% compared with 35.8%) and high triglycerides (37.4% compared with 25.3%). They were also more likely to have diabetes (17.2% compared with 11.2%) and chronic kidney disease (20.1% compared with 12.9%). 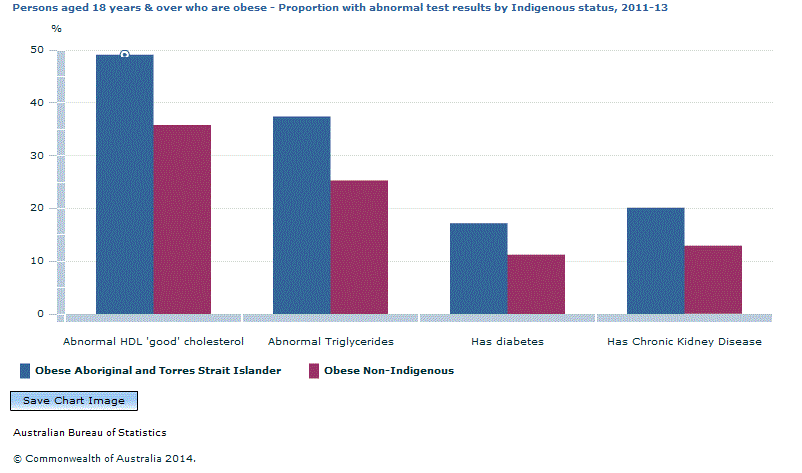 Source(s): Australian Aboriginal and Torres Strait Islander Health Survey: Biomedical Results 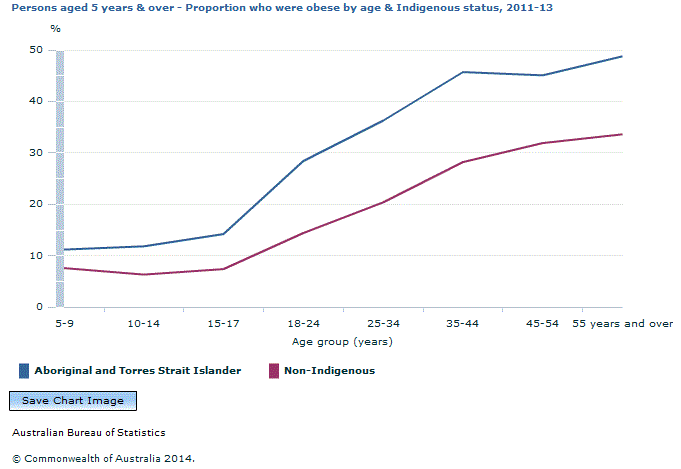 Source(s): Australian Aboriginal and Torres Strait Islander Health Survey: Updated Results Does the risk of chronic disease increase even more if obesity is combined with smoking? Surprisingly, the NATSIHMS showed that the risk of chronic disease did not significantly increase when obesity was combined with smoking. For example, rates of high cholesterol were no different for those Aboriginal and Torres Strait Islander people who both smoked and who were obese compared with all persons who were obese. This was also the case for diabetes and kidney disease. Even independently, smoking was not associated with most of the NATSIHMS biomarkers in 2012–13. While Aboriginal and Torres Strait Islander smokers were more likely than non-smokers to have lower than normal levels of HDL (good) cholesterol, there was no clear relationship with any of the other cardiovascular biomarkers, nor with diabetes or kidney disease. This was different to the pattern seen for non-Indigenous adults, where smokers were more likely than non-smokers to have signs of cardiovascular disease and that the risk increased when obesity and smoking was combined, particularly for people under the age of 45.7 1 Australian Bureau of Statistics 2013, Life Tables for Aboriginal and Torres Strait Islander Australians, 2010-2012, ABS cat. no. 3302.0.55.003 <https://www.abs.gov.au/ausstats/abs@.nsf/mf/3302.0.55.003> 2 AHMAC (Australian Health Ministers' Advisory Council) 2012. Aboriginal and Torres Strait Islander Health Performance Framework 2012 report <http://www.health.gov.au/internet/main/Publishing.nsf/Content/F766FC3D8A697685CA257BF0001C96E8/$File/hpf-2012.pdf> 3 AIHW (Australian Institute of Health and Welfare) 2009, Prevention of cardiovascular disease, diabetes and chronic kidney disease <http://www.aihw.gov.au/publication-detail/?id=6442468313> 4 World Health Organization 2003, Obesity and Overweight, <http://www.who.int/dietphysicalactivity/media/en/gsfs_obesity.pdf> 5 Must A, Spadano J, Coakley EH, Field AE, Colditz G, Dietz WH 1999 The Disease Burden Associated with Overweight and Obesity, Journal of the American Medical Association, <http://jama.jamanetwork.com/article.aspx?articleid=192030> 6 Australian Bureau of Statistics 2013, Australian Aboriginal and Torres Strait Islander Health Survey: Updated Results, 2012–13, ABS cat. no. 4727.0.55.006 <https://www.abs.gov.au/ausstats/abs@.nsf/Lookup/4727.0.55.006main+features12012-13 7 Australian Bureau of Statistics 2013, Australian Health Survey: Biomedical Results for Chronic Disease 2011–12, ABS cat. no. 4364.0.55.005 <https://www.abs.gov.au/ausstats/abs@.nsf/Lookup/4364.0.55.005main+features12011-12. Back to top Document Selection These documents will be presented in a new window.
|
|||||||||||||||||||||||||||||||||||||||||
